
Here we are again
Does not seem long ago then
But something feels different
In what shape is this predicament
I will stick to my day job although are my sentiments at present.
Some comments follow in this market update in relation to current volatility and portfolio positioning.
Extracting financial information daily from news feeds is likely to add fear and short-term bias, it is not a reliable source thus we suggest turning down the noise at this time.
What will this recovery look like?
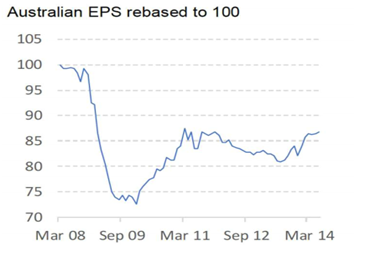
Since 1940, only two cycles in nine or 78% of share market recoveries were not a 'V-Shape'. A 'V-Shape' recovery is a strong share market recovery, where the gain in market earnings per share returns to 90% of the previous peak and takes less than one year to get back to the previous peak. One of the exceptions was the Global Financial Crisis (GFC) and that was an 'L-Shaped' recovery (a weak recovery), taking some years to recover, as shown below:
What will this recovery look like?
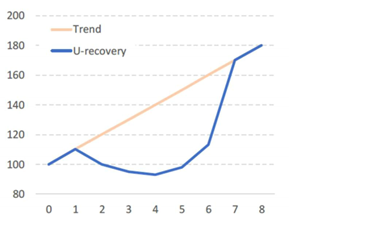
More probably a 'U-Shape' because without stimulus (like we saw in COVID from Feb 2020 to early 2021) and a new impact of inflation on interest rates (from March 2022 supply side bottlenecks and commodity/energy price hikes), more companies are likely to struggle back to a trend level of profits within 12 months. Undersupply and a new timidness in demand are characteristics of a U shape recovery. An example of what we envisage is shown below:
Should you remain invested. Will bad times pass?
Dr. Shane Oliver (AMP Capital) reminds us that worries around the economy and investments are normal, and in times like now, with the world in the midst of pandemic, a war and inflationary shifts, worries do intensify naturally. He observes that for approximately every ten years two years that will be negative. He adds there have not been any negative returns over rolling 20 year periods since records began. The long term return of Australian shares is around 8% year on year.
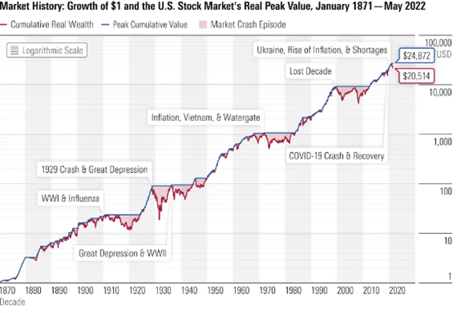
Thus taking a long term view is appropriate when investing into risk assets, and if you can hold on, US Morningstar research says that when the recovery arrives it will more than compensate for the pain and worry, if history is a guide. The following chart was released recently, where a blue line recovery occurs when earnings/valuations recover following an extended crisis (pink shaded area). At some stage these events should settle down.
Inflation and this Interest Rate cycle
Forecast cash rates are being “front loaded” (i.e. more than a regular 25 bps hike) by the RBA and other central banks globally in order to contain and avoid a potentially unwieldy inflationary outcomes and a recessionary situation. This is an impact on uncertainty and volatility but is it actually bad or more of an extraction of capital excesses from the markets following never-before-seen monetary and fiscal stimulus? Consensus cash rate forecasts are for around 2.50% or 2.60% following the 3 year bond yield, and this may arrive even later this calendar year or in 2023.
The risk of course is central banks move too fast or above this rate forecast affecting the ability for households and business to make loan repayment, cost adjustments in their cash flows, and for business equally and including a re-pricing of their services. But interest rates surely could not stay at zero forever. Has the market over-reacted given there is some capacity to absorb rate rises? Food and energy have fed inflation levels but how much is attributed to supply bottle necks and oil/gas shortages and will they continue? Even central banks do not know but the truth or the answer will be in the middle of these extremes.
A Note on Timing Markets
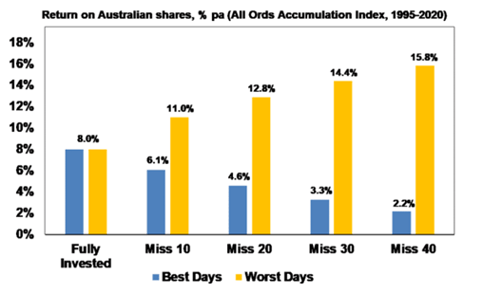
It is worth reflecting that timing of the market is not an easy task, or more accurately is a very difficult cost and time intensive process to successfully achieve. Missing the best and worst days can materially affect investment portfolio performance, and this is why we generally invest fully but only into quality investments, often liquid ones too. For example, if you remain fully invested you could expect an 8% return from Australian shares 1995-2020 (with dividends but not allowing for tax and fees), but if you miss the best 10 days earn less 6.1% or somehow avoid the worst days achieve a great 11%, as can be shown:
It is easy to sell but where does one go in times like this? Perhaps it is better to sell/take profits when the market is over-valued than it is to sell/crystallise a loss when assets are under-valued as they are now. Using cash, also from regular contributions or income receipts when rotating into new assets can help add value.
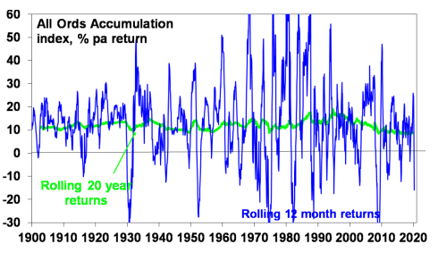
And below, Australian shares rolling 12 months over 20 years since 1900 confirm a steady 8% return from remaining fully invested in Australian shares and collecting dividends:
Returns
At the time of writing, it appears the ASX All Ordinaries Accumulation Index will return -10% for the year to 30 June 2022, a rather painful and rare event that has taken us and many investors by surprise.
In the US, the S&P500 has been in a bear market all year, and for the financial year is around -15%, but for the first-half of the calendar year is -21%.
Europe and Asia similar but they offer differing risk profiles being the impact of war in Ukraine and Chinese government COVID lockdowns respectively.
Most equity markets and sectors now offer reasonable value, unlike some property and unlisted assets.
The Role of Diversification in Portfolios
Property, real assets and unlisted assets have faired relatively well by comparison to equities however due to their illiquid and infrequent valuation process they may still be impacted by changes in interest rates and an economic slowdown. Certainly we are now seeing the removal of frothy residential prices in Sydney, Melbourne and now Brisbane. We expect a short, continued decline of consumer and investor sentiment, being a slowdown of credit borrowing, and reduction in consumer spending and investment that will further impact earnings, but on the data available today we do not see this extending long term.
You can however prepare for the next correction using diversification to include counter cyclical investments like real property, real assets at a good price and unlisted structures to help with valuation and return on earnings stability. These investments reduce volatility in portfolios and supply a satisfactory yield similar to the dividend yield in Australian shares. Both Ian and I are happy to discuss these further with you in our reviews during the year.
Final thoughts
In summary, there are several themes that emerge during large stock market declines:
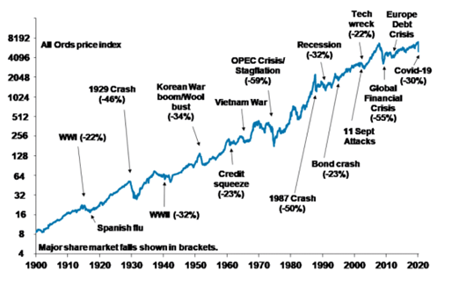
- From time to time, share markets go through long and deep periods of decline, and at times are unpredictable
- -10% corrections occur regularly and are considered normal, admittedly we only just had one in 2020 too
- After a large decline, it is hard to predict how long they will recover but they usually do
- Over the very long run, share markets have been very generous to investors who stay the course
- During periods of rapid and deep decline, investors should avoid panic selling given they will be compensated in time
- Always follow a quality criteria towards investment selection and adopt diversification via asset class allocation and sector for robust portfolio performance during times such as this
- Holding cash is ideal for portfolios in drawdown phase to avoid selling risk assets in times of market corrections (referred to as sequencing risk)
For More Information
If you have any queries or concerns please contact James or Ian on (07) 3002 2690 or by email at any time. We are here to assist you.
